

Three Ways to Maximize Data Collection Using Surveys

The Survey Node is a new processing node for Dispatcher Stratus that takes multiple form submissions and combines them into a single comprehensive report. This new node is highly useful for conducting research, gathering information, and generally keeping a finger on the pulse of a constituent body. Here are a few ways you can get the most out of the new Survey Node:
-
Configure your report frequency to cover all bases
For example, say a company is looking for Employee of the Month nominations. They have 500 employees, but they would like regular updates to see results as they come in. To achieve this, configure the Survey Node like this:
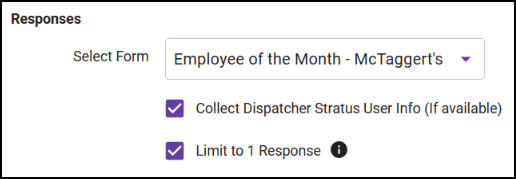
Step 1: Select the Employee of the Month form from the drop-down.
Step 2: Select both the “Collect Dispatcher Stratus User Info” and “Limit to 1 Response” to ensure data validity.
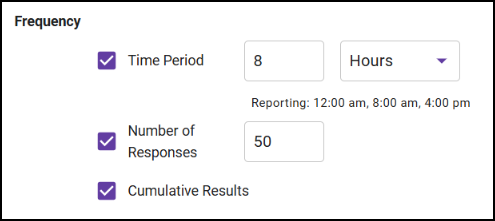
Step 3: Enter a time period of 1 day to receive regular reports.
Step 4: Enter 500 in the Number of Responses field to get a report when every employee has responded.
Now let's say a town is looking to name a new snowplow. They expect hundreds of submissions, so they configure a report to be generated every 100 responses to keep tabs on the results. But because of the holiday season, response rates are very low – below 100 in total. The workflow can also be configured to generate a report after 14 days (the posted end of the contest), so they still get the results in a timely manner even though the response is lower than expected.
Step 1: Select the Snowplow Name Contest form from the drop-down.
Step 2: Enter a time period of 14 days to receive that final report.
Step 3: Enter 100 in the Number of Responses field to get regular reports.
-
Configure your report to display the data in the way that makes sense
Reports can be cumulative or non-cumulative; that is, they can show the entire data set or only the data for the most recent set of responses. Whether you want the reports as an ongoing record of the entire survey process or as a snapshot of a specific time frame will determine how your data is collected and collated.
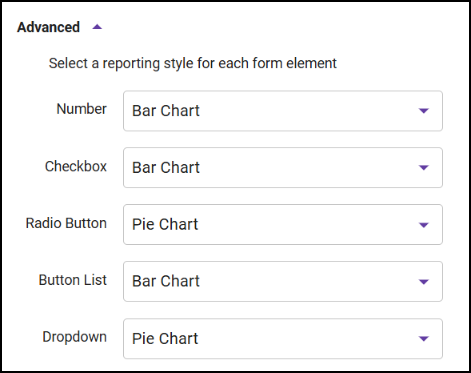
Once you have your form configured with the information you want to receive, you can modify the survey report to display the information in a way that makes the most sense for the data you're looking for. For example, say you have a form asking which option looks best: A, B, or C. That information can be displayed as a table, a bar chart, or a pie chart. This particular type of information is most readable as a pie chart but can be displayed in another way if needed. To adjust how each field type is displayed, do the following:
Step 1: Expand the Advanced section in the node configuration window.
Step 2: Using the drop-downs available, update the display method.
-
Automate the distribution of reports
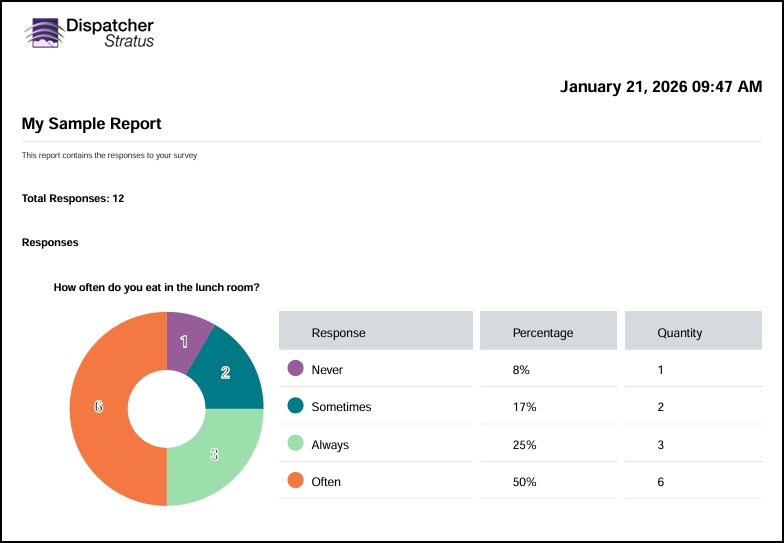
The Survey Node creates the report, as described, as well as maintaining the form metadata for every submission. When the report is created, it can be sent through the rest of the workflow just like any other document, allowing it to be modified by other Process nodes and distributed to various third-party content management systems, storage systems, or even as an email attachment. This ensures that the people who need the information that's been gathered have access to it quickly and securely.
The Survey Node is available for Dispatcher Stratus customers. To take advantage of this powerful new feature, contact your Konica Minolta representative.